

As someone with time blindness I can very easily sink time into something without realizing.
This year I’m experimenting with spreadsheets and time charts as tools to visualize time. Here is how 2025 has been looking (as of March 24.)
January
I had a lot of loops to close in January and it felt like a ton of admin. This was my first month tracking my time. The pie chart was a game changer. I started it mid month and the wedges for web & self publishing dominated the chart. It took conscious effort to put more time into personal projects to balance the chart out.
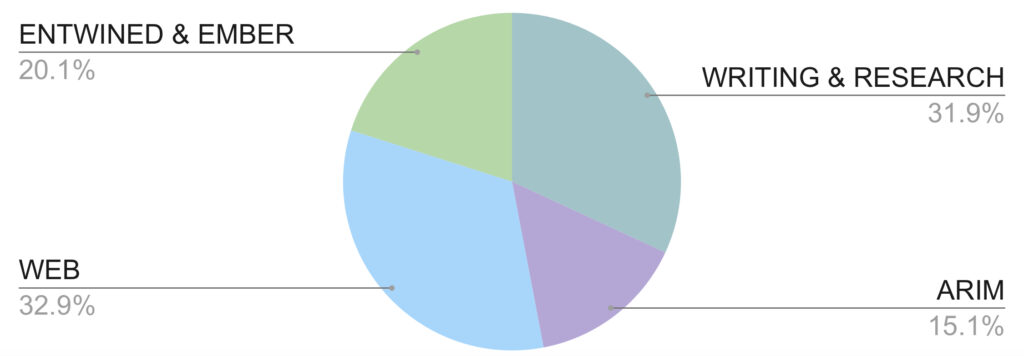
Writing & Research (31.9%)
Most of this was my fantasy novel Mawd.
Web (32.9%)
Mostly Substack – my own newsletter & wrapping up Neurokind.
Entwined & Ember (20.1%)
Admin for self publishing these books.
ARIM (15.1%)
This is time spent on my Artist’s Residency in Motherhood making visual art for My Brain on Motherhood.
February
This month my biggest wedge was redesigning my website. But seeing how big the blue wedge was motivated me to make time for other things.
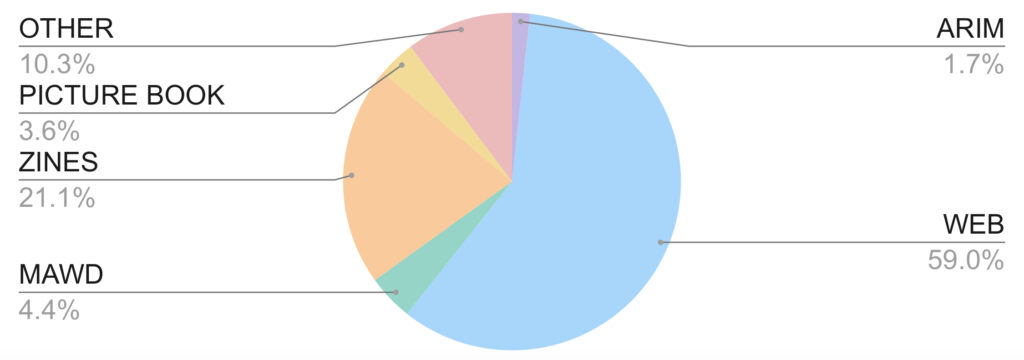
Web (59.0%)
Redesigning my website and migrating my newsletter to Buttondown.
Zines (21.1%)
Making Not About TETRIS and working on illustrations for a zine about the spectrum of neurodivergence. My scanner died this month and created a lot of headaches.
Other (10.3%)
Designed two self inking stamps (folks with zine subs will see these soon) and sewing patches on a denim jacket.
Mawd (4.4%)
Work on my fiction novel. I’m in an ideation phase.
Picture Book (3.6%)
Admin for self publishing How it Feels to Me.
March
My website wedge is still the largest (although I have a few days to go) based on shop and subscription migration headaches. I hope to continue making this wedge smaller over time.
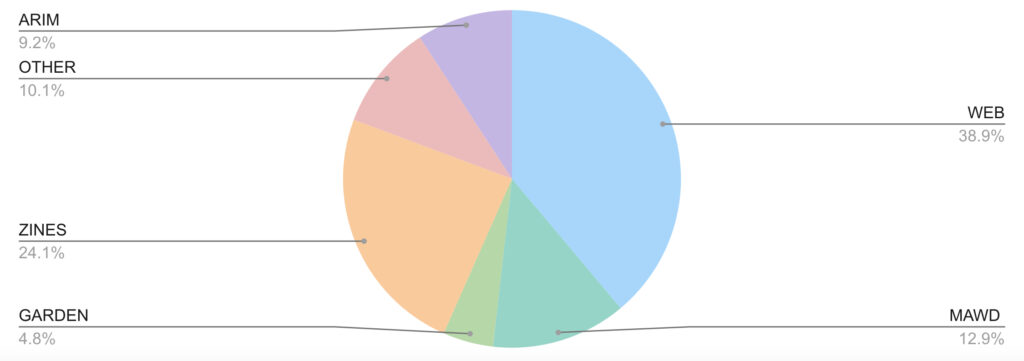
Web (38.9.0%)
Moving zine subs from Big Cartel to Stripe, redoing various opt ins, migrating Neurokind to Beehiiv, archiving March blog posts, and writing for blog & newsletter.
Zines (21.1%)
Making I’m Fine zine and a few Wheel of Time mini zines.
Mawd (12.9%)
Work on my fiction novel. Still in an ideation phase.
Other (10.1%)
Sewing patches & picture book admin (maybe that should be separated.)
ARIM (9.2%)
Working on Bloom Where You’re Planted.
Gardening (4.8%)
I debated over logging this, but it is important self regulating work and part of my creative ecosystem.
Reducing Admin Time
I also did a bar chart showing the different parts of the process to see that balance.
Here you see Admin & Prep decreasing and time to Create growing from January to March.
I’m 90% sure this shift would not have happened without this visual tool. It’s too easy to get pulled into neverending admin and website tweaks. This makes me more aware.

Top Tip
I found tracking the time itself really hard until I started using the Tap When app. (Not a sponsor.) I tap when I start and tap when I finish. No math!
P.S. My spreadsheets are in no condition to officially share as a resource, but if you’d like to see the imperfect version I’m working with I’m happy to share the template for you to make your own. Just drop me a line or respond to a newsletter.
Image Credit: Prague Astronomical Clock via Wiki Commons